To talk of learning as a process which we can observe is very difficult. When we teach teachers, we teach "theories" of learning which are just-so stories with little hard evidence to back them up barring a few (now famous) psychological experiments. The resort to teaching theory is partly because this is so hard that we would struggle to decide what we should talk about if we didn't just talk about theory. The irony is that talking about theory can be very boring, encouraging professors who didn't think of any theory themselves to talk endlessly about what's written in textbooks - not exactly an example of good teaching! Ultimately we end up with what is easiest to deliver, rather than what needs to be talked about.
I think the birth of cybernetics in the 1940s was the best chance we had of remedying this situation, but for various reasons, a lot of this transdisciplinary insight was lost in the 1950s and 60s, as other disciplines (notably psychology) appropriated bits of it but lost sight of its key insights. Now, the growth of machine learning is providing a new impetus to revisit cybernetic thinking, with people like James Bridle leading the way in a revised presentation of these ideas (see his "Ways of Being"). One of the most impressive things about Bridle's book is the fact that he reconnects cybernetics to biology and consciousness. That connection was at the heart of the original thinking in the discipline. The biology/consciousness thing is really important - but isn't it just another just-so story? If we don't have any way of measuring anything, then I'm afraid it is.
Here perhaps we need to look a bit deeper at the whole issue of "measurement" as it is practiced in the social sciences. Another historical development from the 1950s was the increasing dominance of statistical techniques in disciplines like economics. Tony Lawson argues that this was directly connected to the McCarthy period, where anything statistical was "trusted" as scientific and anything "critical" was communist! - as Lawson points out in his "Economics and Reality", the greatest economists of the 20th century (including Hayek and Keynes) were highly skeptical of the use of mathematics in economics.
Statistical techniques are regularly used in academic papers in education to defend some independent variable's impact on learning. These are usually the result of academic training in statistics for researchers - not the result of a critical and scientific inquiry into the the applicability of techniques of probability to education. But there are fundamental questions to ask about statistical procedures. These include:
- Why do natural phenomena reveal normal (Gaussian) distributions in the first place?
- What is an independent variable, and why should an independent variable (if such a thing exists) produce a new normal distribution?
- All statistics is about counting - but what is counted in something like learning, and how are the distinctions made between different elements that are counted?
- What happens to the uncertainty about distinction-making in what is counted (Keynes made this point in his "Treatise on Probability" with regard to his discussion about Hume's distinguishing between eggs)
- Where is the observer in the counting process? Are they an independent variable?
- It is well-recognised that "exogenous variables" are highly significant causal factors - particularly in economics (which is often why economic predictions are wrong). Yet normal distributions arise even when exogenous variables are bracketed-out. Why?
- While one big problem with statistical techniques is the fact that averages are not specifics, averages nevertheless can sometimes prove useful in making effective interventions. Why?
- Why does statistical regression (sometimes) work? (particularly as we see in machine learning)
- Is a confidence interval uncertainty?
These are the kind of "stupid questions" which never get asked in education research, or anywhere else outside philosophy for that matter. I want here to think about the first one because I think it underpins all the others.
Normal distributions (calculated using mathematical equations developed by de Moivre, Euler and Gauss in the 18/19th centuries) require a statistical mean and standard deviation to produce a model of likelihood of a set of results. Behind the reliability of these assumptions is the fact that there is - among the phenomena which are measured - some common point of origin from which the variety of possible results can be obtained. Thus the top of a bell curve indicates the result which is maximally probable having passed through all the possible variations that stem from a common point of origin.
Mathematically, we can produce a normal distribution from techniques arising from Central Limit Theorem (CLT), where a normal distribution will arise from the sums of normalised random data (see
https://en.wikipedia.org/wiki/Central_limit_theorem) . According to Ramsey (
https://en.wikipedia.org/wiki/Ramsey%27s_theorem) and others, true randomness is impossible. So the normal distribution is really a reflection of deeper order arising from a single point of origin. What is this point of origin? What does a normal distribution in educational research really point to?
It must lie in biology, and (importantly) the fact that biology itself must have a common point of origin. Because we tend to think of education as a cultural phenomenon, not a natural one, this point is missed. But we are all made of the same physiological stuff. And the components of our physiology have a shared evolutionary history, and it is highly likely that this shared evolutionary history has a point source. So looking at your educational bell curve is really looking at the "red-shift" of biological origins. This is an important reason why it "works".
However, this doesn't explain learning itself - it just helps to explain the diversity of features (behaviour) in a population which can be observed statistically. Much more interesting, however, is to look at how the process of making distinctions arises given that normal distributions are everywhere.
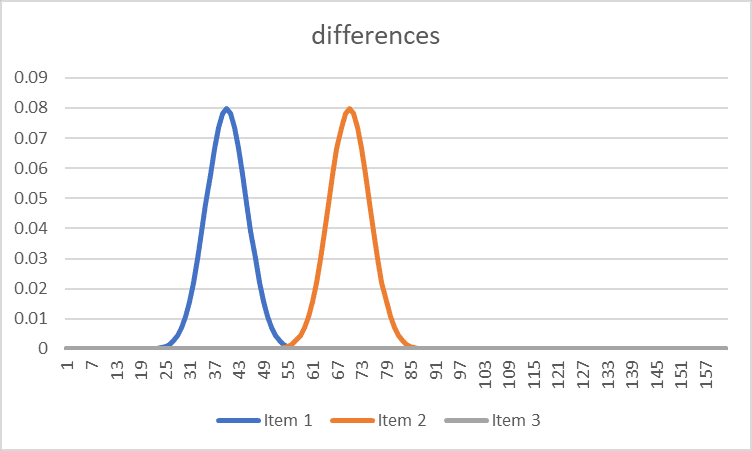
This is why psychophysics is so interesting. The psychophysicists were interested in the distributed differences that different stimuli make on a population. Some differences make big differences in perception: for example, hot and cold. Other differences are harder to distinguish - for example, the difference between Titian and Tintoretto. These differences can also be represented statistically. For example, the orange curve below might be "hot", and the blue curve might be "cold". There is little uncertainty between these distinctions, and within any population, there is no question that what is hot is identified as hot (with a little variation of degree).
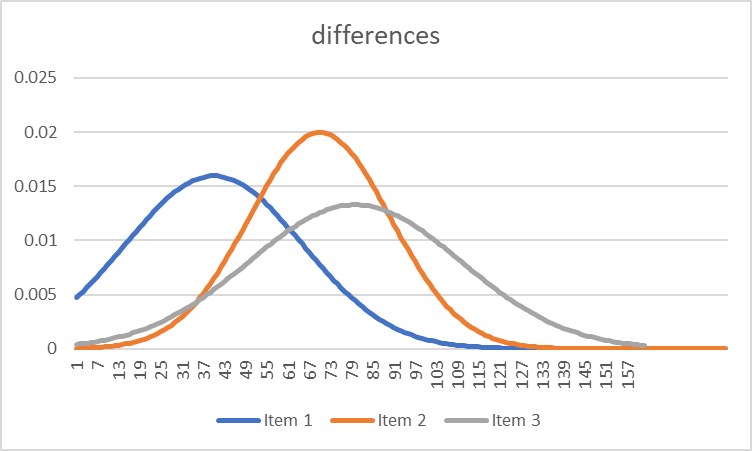
But here (below), there is much more uncertainty in distinction making.
It is this kind of uncertainty in making distinctions between things which characterises learning processes at their outset. Whether it is being able to distinguish the pronunciation of words in a foreign language, or being able to manipulate a new piece of software, among the various categories of distinctions to be made, there is a huge overlap which leaves learners initially confused.
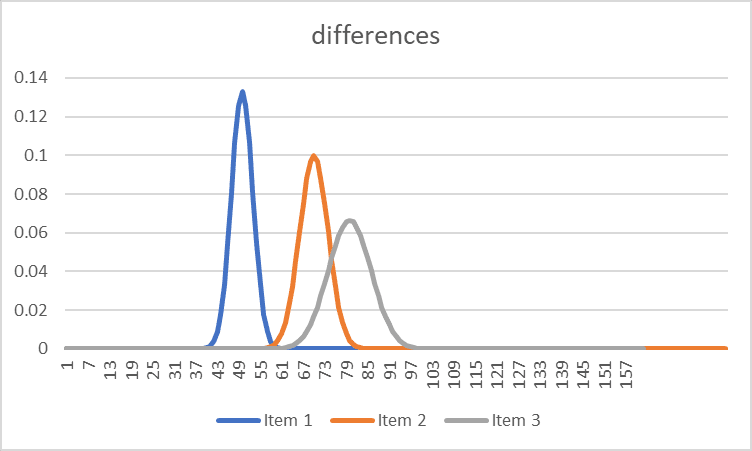
As the learning process continues, this distinction-making becomes more defined:
So given phenomenon x, the likelihood of correct categorisation of that phenomena is improved.
But it is important to remember what these graphs are really telling us - that the Gaussian distribution implies a common point of origin. The second graph is the result of a conditioning process upon natural origins - rather like a cultivated garden. But perhaps more importantly, this is dynamic, where the point of origin is ever-present, and exerts an influence on distinction-making. This may be why, despite increases in the ability to make distinctions in one domain, there is a biological requirement to relax distinction making in other domains, and these domains may be related.
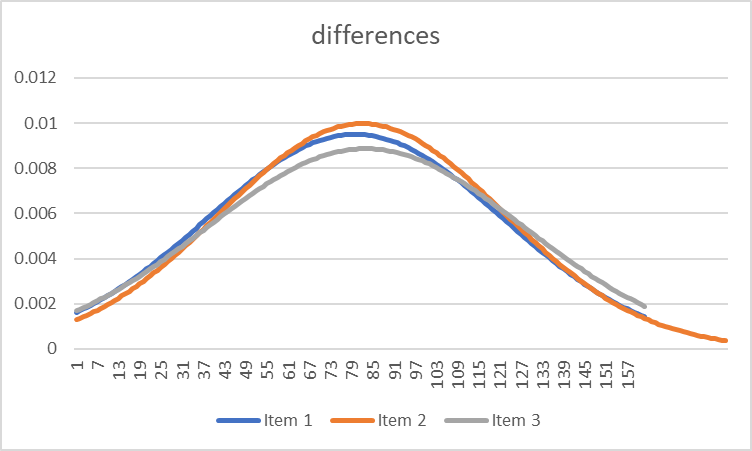
"Oceanic" experiences - those that Freud associated with the "primary process" of the subconscious remain an important part of the overall dynamic of distinction-making. This looks something like this:
We make the mistake of seeing learning in terms of moving towards graphs 1 and 3, without seeing the dynamic pulse which relates graphs 1 and 3 to graphs 2 and 4. But this process is critical - without the oceanic connection to distinctionlessness, the coordination mechanism (i.e. reference to origins) which facilitates higher-order distinctions (graph 3) cannot coordinate itself and is more likely to collapse in a kind of schizophrenia (this is what Freud talked about in terms of the superego taking over and the psychodynamics breaking down).
Looking at learning like this does two things. It invites us to think about our methods of scientific measurement differently - particularly statistics - as a means of looking at life processes as processes which refer to a common origin. Secondly, it gives us a compass for assessing the interventions we make. Our current lack of a compass in education and society is quite obvious.

No comments:
Post a Comment